

Each year, publicly listed companies must submit a Form 10-K to the U.S. Securities and Exchange Commission (SEC) – an annual report that includes financial results, business operations, risk factors and business strategies. The Palo Alto Networks 2024 10-K revenue net income data is some of the most important information for investors, analysts and enterprise IT professionals in the cybersecurity industry.
Palo Alto Networks’ fiscal year 2024 (FY2024) was a momentous one. It hit new financial milestones, achieved an all-time high in revenue, and significantly boosted profits. In this article, we’ll explore the key metrics in the 10-K filing, put them into context, and give you a sense of the company’s current state of affairs.
What Is a 10-K Filing?
To make sense of the numbers, let’s first explain what a 10-K is. A 10-K is an annual filing with the Securities and Exchange Commission (SEC) by U.S. companies. It is a very detailed report and contains:
Audited financials (balance sheet, income statement, cash flow statement)
Management’s discussion and analysis (MD&A)
Business overview and competitive landscape
Risk factors
Information about executive compensation and corporate governance
When investors search for Palo Alto Networks 2024 10-K revenue net income, the section of the 10-K called the income statement is where they will find the indisputable, audited data used to calculate these numbers.
The Palo Alto Networks fiscal year ends on July 31 – so the fiscal year 2024 (FY2024) was from August 1, 2023, to July 31, 2024.
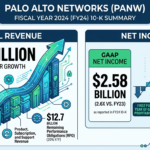
FY2024 Revenue: $8.03 Billion
The standout figure from the Palo Alto Networks 2024 10-K revenue net income report is the amount of total revenue for fiscal year 2024, at $8.027 billion. This is up 16.5% from $6.892 billion for fiscal year 2023, which is an impressive growth rate for a company of Palo Alto Networks’ size.
Revenue Breakdown by Category
Palo Alto Networks breaks its revenue by category into two main areas:
Revenue Category FY2024 (in millions) % of Total YoY Growth
Product Revenue $1,603.3 20.0% +1.6%
Subscription & Support $6,424.2 80.0% +20.9%
Total Revenue $8,027.5 100% +16.5%
There are a couple of things to note about this data:
80% of revenue is now subscription and support. This is a major trend that has taken place over the past few years as Palo Alto Networks has evolved from a hardware-oriented firewall vendor to a software and subscription-based cybersecurity company. Recurring revenue is attractive to investors because it is more stable and scalable, and has higher margins than hardware sales.
Product revenue growth was effectively flat at +1.6%. This is in line with the overall trend in enterprise technology, where hardware refresh cycles are lengthening as customers shift towards software-defined and cloud delivered services. Palo Alto Networks has embraced this trend, focusing on its cloud and SASE products.
$2.58 Billion in FY2024 Net Income – A Year of Change
Probably the most notable number in the Palo Alto Networks 2024 10-K revenue net income report is the company’s net income of $2.577 billion, a 486% year-on-year increase from $439.7 million in FY2023.
As a comparison: in FY2022, Palo Alto Networks had a net loss of $267 million. Palo Alto Networks went from a loss of hundreds of millions of dollars to a net income of almost $2.6 billion within two years.
FY GAAP Net Income (Loss) YoY Change
FY2022 ($267.0M) —
FY2023 $439.7M +$706.7M
FY2024 $2,577.6M +$2,137.9M
Why did the Net Income Spike?
The massive increase in net income between FY2023 and FY2024 was due to several factors:
1. Improved Operating Performance
Operating income reached $683.9 million in FY2024, up from $387.3 million in FY2023. This is a result of increased efficiency and the operating leverage of a subscription-based business as it grows – more revenue with lower cost increases.
2. Tax Benefit
The other significant component of the net income recorded in FY2024 was a tax benefit of $1.589 billion (compared to a tax provision of $126.6 million in FY2023). This was mainly due to the recognition of deferred tax assets, such as net operating loss carryforwards that the company has generated in its loss-making years. Although this is a non-cash item and will not be as significant in future years, it played an important role in the all-time high GAAP net income.
3. Growing Gross Profit
Total gross profit rose to $5.968 billion in FY2024, representing a 74.3% gross margin — up from 72.3% in FY2023 and 68.8% in FY2022. The continuing increase in margin reflects the shift to higher margin subscription revenue and rising operational efficiency.
Top Profitability Metrics from the FY2024 10-K
In addition to the topline revenue and net income figures, the Palo Alto Networks 2024 10-K revenue net income report includes other metrics that offer insights into the financial performance.
Gross Profit and Gross Margin
Metric FY2024 FY2023 FY2022
Total Gross Profit $5,968.3M $4,983.0M $3,782.8M
Gross Margin 74.3% 72.3% 68.8%
The gross margin has improved by over 5 percentage points in just 2 years, as the company continues to focus on software and subscriptions.
Operating Income and Operating Margin
Metric FY2024 FY2023 FY2022
Operating Income $683.9M $387.3M ($188.8M)
Operating Margin 8.5% 5.6% (3.4%)
After posting an operating loss in FY2022, the company delivered a strong operating income in FY2024 of $683.9 million, with an operating margin of 8.5%.
Earnings Per Share
The net income per share (basic) in FY2024 was $8.07, up from previous years. This is key for investors to determine the return on each share they currently own or may want to buy.
Related topic’s:
As highlighted in the context of the 2024 Gartner Magic Quadrant Enterprise Wired and Wireless LAN Infrastructure Palo Alto Networks report, security integration has become a top criterion. Organizations want their LAN infrastructure to natively support security policies rather than treating security as an afterthought.
Next-Generation Security ARR: The Engine for Growth
The one thing that all Palo Alto Networks investors and analysts watch is the Next-Generation Security Annual Recurring Revenue (NGS ARR). This represents the annualized value of recurring revenue for new, cloud security products such as Prisma Cloud, Prisma SASE and Cortex.
In the fiscal year (FY) 2024, NGS ARR increased 43% year over year to $4.2 billion. This is the highest-growth part of the business, and the best predictor of the future of Palo Alto Networks. As NGS ARR grows, it will soon become the most significant contributor to revenue – and because these products have high margins, NGS ARR growth enables margin expansion.
Remaining Performance Obligation: Looking to the Future
Another important 10-K metric that investors focus on is the Remaining Performance Obligation (RPO). RPO is the total amount of revenue that has been contracted but not yet recognised – in other words, a queue of future revenue from existing customers.
Palo Alto Networks’ RPO at the end of FY2024 stood at $12.7 billion, up 20% year-over-year. This is an excellent measure of future revenue visibility and a key measure for health and customer loyalty.
Q4 FY2024: The Last Stand
The fiscal year 2024 fourth quarter (ended July 31, 2024) was in the mix for the year:
Q4 FY2024 Total Revenue: $2.2 billion — up 12% year over year
Q4 FY2024 GAAP Net Income: $357.7 million — up 57.1% year over year
Q4 FY2024 Non-GAAP Net Income: $522.2 million
The Q4 results were released on August 19, 2024 and were well received by investors, with the stock up around 2% in after-hours trading.
Related topic’s:
For those watching a highly anticipated cybersecurity stock, the Palo Alto Networks stock price July 31 2024 close is a significant piece of information. On July 31, 2024, the stock of Palo Alto Networks (ticker: PANW) finished at $162.37, up about 1.3% on the day. To put the stock price in context, it is important to understand the company, its performance, and the landscape of the cybersecurity industry.
The Platform Shift: Revenue Composition
It’s important to put the Palo Alto Networks 2024 10-K revenue net income figures in context in light of the company’s strategic transformation. Palo Alto Networks has been implementing a “platformization” strategy – getting enterprise customers to spend their security dollars on the Palo Alto platform rather than a variety of point solutions from different vendors.
This approach has two financial consequences:
Short-term challenges: In FY2024, the company provided financing options and free trials to some products to drive platform uptake. This had a negative impact on billings and cash flow in the short term.
Long-term tailwinds: Full platform adopters have higher retention, increased spending, and are less easily replaced. When you get a multi-year customer where network, cloud and security are all managed in the vendor’s platform, it’s very hard to replace.
This is one of the factors driving the attention given to NGS ARR – the recurring revenue associated with platform adoption – as a key predictor of long-term revenue streams.
Year-Over-Year Financial Comparison
Here’s a consolidated overview of the key income statement metrics from Palo Alto Networks’ FY2024 10-K:
Metric FY2024 FY2023 FY2022
Total Revenue $8,027.5M $6,892.7M $5,501.5M
Total Gross Profit $5,968.3M $4,983.0M $3,782.8M
Gross Margin 74.3% 72.3% 68.8%
Total Operating Expenses $5,284.4M $4,595.7M $3,971.6M
Operating Income (Loss) $683.9M $387.3M ($188.8M)
Net Income (Loss) $2,577.6M $439.7M ($267.0M)
What the Numbers Mean for Investors
The Palo Alto Networks 2024 10-K revenue net income data is a testament to the company’s ability to evolve from its days of “growth at all costs” to a more sustainable growth with profitability model.
The messages for long-term investors in FY2024 are:
Revenue scale: With $8 billion in revenue, Palo Alto Networks is now squarely in the large-cap enterprise technology space and has the scale to invest in R&D, sales and acquisitions.
Subscription model: 80% subscription revenues make the business model more sustainable and predictable.
Operating income: Turning from operating loss to profitability is an inflection point and testament to cost management.
Revenue predictability: With a RPO of $12.7 billion, there’s visibility to future revenue streams – this gives investors confidence about future growth and value.
How to View the 10-K
You can access the Palo Alto Networks FY2024 Form 10-K in its entirety at:
SEC EDGAR (sec.gov) – Click on the PANW filings to view the entire document
Palo Alto Networks Investor Relations (investors.paloaltonetworks.com) – The firm’s IR website has all SEC and earnings documents
Data vendors like Bloomberg, FactSet, Refinitiv, and Morningstar offer the data in a structured format
Final Thoughts
Palo Alto Networks 2024 10-K revenue net income figures mark a pivotal point in its financial journey. Revenue of $8.03 billion (up 16.5% year-on-year) and net income of $2.58 billion (up 486% year-on-year) show that the company’s emphasis on platform-based cybersecurity is starting to bear fruit.
For enterprise IT leaders, the healthy financials in the 10-K also represent a sign of vendor stability. Having a cybersecurity partner who is financially stable, growing and investing in innovation decreases the likelihood of disruption to your security program. For shareholders, the FY2024 report provides a solid platform for future growth as the company works towards its goal of being the cybersecurity platform of the future in the age of AI.
This article is for informational purposes only and should not be considered financial or investment advice. All data is from Palo Alto Networks’ publicly available Form 10-K for fiscal year 2024 (July 31, 2024). Please consult with a qualified financial advisor for investment advice.